Day 10: COMPAS discussion
Agenda
- 3:45-3:55: Instructor-led debrief on assignment 9.
- 3:55-4:15pm: Gathering information based on sources
- 4:15-4:30pm: Large group debrief and introduction of impossibility theorem
- 4:30-4:50: Small group exploration and sense-making of fairness metrics
- 4:50-5:25pm: Large group discussion of the big picture
Debrief on Assignment 9
I’ll go over some key points from assignment 9.
Let’s start by reviewing the first notebook from assignment 9. We want to make sure you understand the key idea of hand-coded features versus learning features from data.
Here are the loss graphs (cross entropy) that you generated for the hand-written digit dataset.
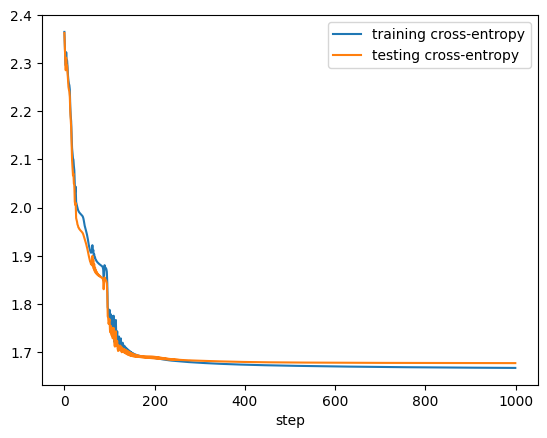
The cross entropy on the handwritten digit classification task. The x-axis refers to the number of gradient descent steps.
Here is the equation for cross entropy. \(\begin{aligned} ce(\hat{\mathbf{y}}, y) = \sum_{i=1}^{k} -\mathbf{I}[y = i] \log \hat{y}_i \end{aligned}\)
Let’s interpret this together.
Gather information based on external sources
On the whiteboard, please gather pieces of information that we learned from the readings or other sources. Take turns having each person share one thing that they wrote down for Exercise 1 in the last assignment.
Large group debrief and introduction of the impossibility theorem
Here are some summary slides, which also include reference to the study Sam mentioned with humans attempting to predict re-arrest.
We’ll summarize some key takeaways and show an example from an extreme version to help us wrap our heads around different models of fairness. https://medium.com/@alex.liu. roc/understanding-the-impossibility-of-fairness-199bba6c9072. Also consider looking at the original source that showed the impossibility result. In that work, the authors shows that the following equation must hold for all groups according to the prevalence of a positive for members of that group, $p$.
\[\begin{aligned} \text{FPR} = \frac{p}{1-p} \frac{1 - \text{PPV}}{\text{PPV}} (1 - \text{FNR}) \end{aligned}\]Small group exploration and sense-making of fairness metrics
The field of fairness and applications to human or algorithmic decision making is vast. Here are a few resources to guide your exploration of fairness metrics:
- IBM’s exploration of COMPAS and fairness metrics
- One group that made a tool for fairness and has a flowchart
- Orange and blue dot example of fairness from the last assignment
- Fair prediction with disparate impact - math paper on COMPAS
Large group discussion of the big picture
We will close our computers for this part and have a large group guided discussion.